Documentation
This guide explains the use of the Climate Resilient City Tool going through the initial setup and configuration step by step. More detailed information on the tool can be found on this website.
First, read, discuss and accept the disclaimer and copyrights. All participants have to understand and agree that the results of the CRCTool are merely indicative and cannot be used for final design and decision making. After accepting the disclaimer and copyrights you can start using the tool.
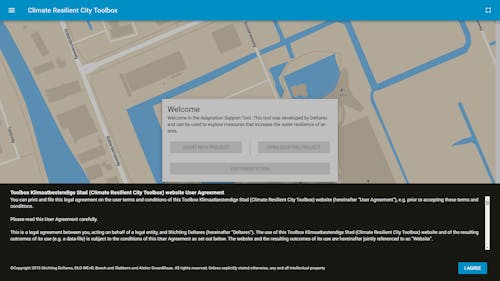
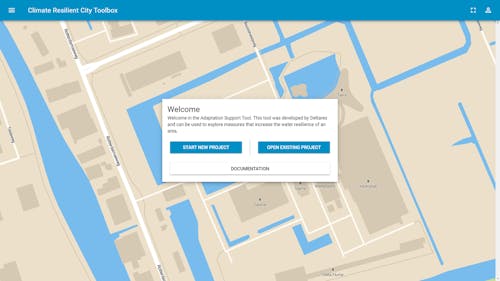
To use the CRCTool for the first time, select Start a new project or, in case you already have a saved project select Open existing project.
Map Window
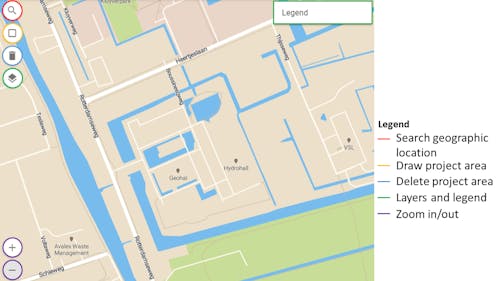
The map window contains several buttons to perform actions.
Project set up
First, search for the area where you want to make the project after accepting both the disclaimer and copyrights, and starting the project.
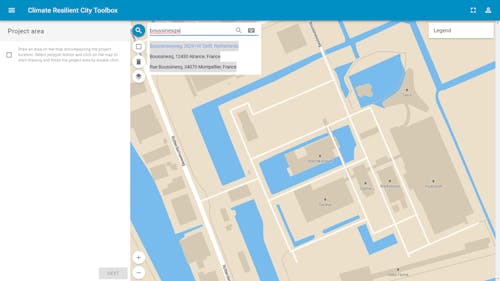
The map will move to the selected location.
Once the right project location is found on the map, draw an area to indicate the project area using the button indicated with the green rectangle. The boundary of the project area can be drawn by clicking on the map and finalizing it by double clicking on the last point of the boundary.
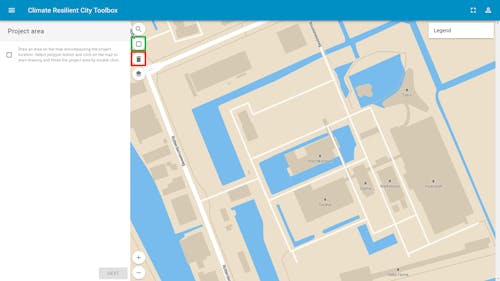
A project area can be deleted with the trash button indicated in red.
Once a project area is drawn, a NEXT button will appear to continue with the project area setup.
Press "NEXT" to continue and fill out all the parameters of the project area. Brief explanations on the options can be shown by pressing the i, information button. Notice that you will not be able to go to the next step until you have filled out all the parameters.
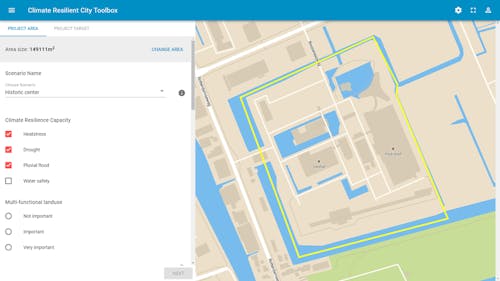
Once all the parameters of the project area have been filled, press DONE to continue.
Now adaptation measures can be added to the project area. Measures can be added in two ways:
- Press the + measure button at the bottom of the left panel to first select the preferred measure and then draw the measure on the map.
- Press the draw area, line or point button to first draw an area, line or point and assign a measure to this object.
In case of + measure button is pressed an overview of all available measures appears.
The list of measures is ranked according to their effectiveness based on the properties of the project area and the climate adaptation goal for the project area. A search field is provided to search for a specific measure. A star button on the top of the list moves preferred measures based on the type of scenario to the top of the list.
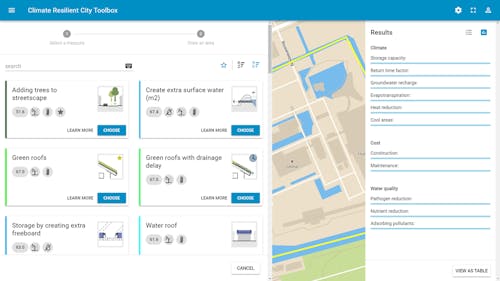
The number underneath the title of the measure indicates the effectiveness of a measure based on the properties of the project area. The icons as listed below indicate to what climate effect the measures contribute.
In order to have more information on a certain measure, click LEARN MORE. When clicking LEARN MORE, both the effect on climate change, a short description and image will be shown.
A measure can be selected by pressing the CHOOSE button
Then you can start drawing the measure on the map as area, line or point. The draw options (point, line areas) depend on the type of measure chosen. An area or line can be drawn by clicking on the map to add the corners of the area or line. The area or line can be finished by double clicking on the same location. A point only requires on click to be added at the right location.

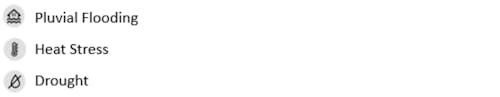
Once a measure has been selected and added to the map, the measure settings panel appears. In this panel the depth and inflow area can be given in. In case of a line measure a width needs to be given in and in case of a point measure a radius needs to be given in. Default values are provided for all settings. Additional information on the settings can be found by pressing the information buttons.
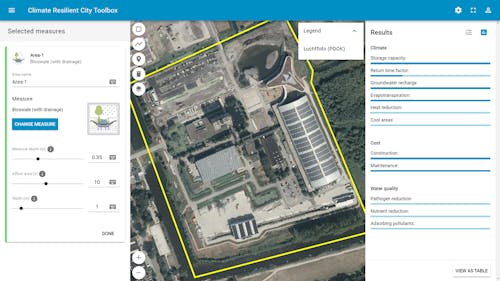
In case one first wants to draw an area, line or point on the map to design the area, first select the draw, area, line, point tool in the top left corner of the map window. An area or line can be drawn by clicking on the map to add the corners of the area or line. The area or line can be finished by double clicking on the same location. A point only requires on click to be added at the right location.
Once the element is added to the map the panel on the left will show an option CHOOSE MEASURE to select a measure for the area.
By selecting this option a list similar as shown above is presented. The list may vary based on whether an area, line or point has been added. A measure can be assigned by pressing CHOOSE MEASURE.
After choosing the measure the property window of the measure is shown, similarly to the one presented above. Once the correct values are given in, the measure can be finalized by pressing DONE.
Once a measure has been added the type and the properties can be changed by selecting the measure on the map. To change the shape of areas, lines and points click the element on the map and then selecting one of the corners of the element. The corner should enlarge and can now be moved on the map with the mouse. Additional points are added to the line that can be used to create new corners.
Scenario metrics
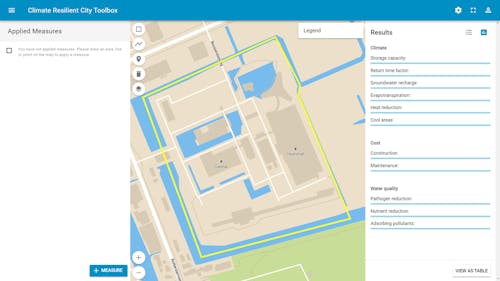
On the right side of the map, the results of applied measures are visualized. These are divided into results with regards to climate adaptation, costs and water quality.
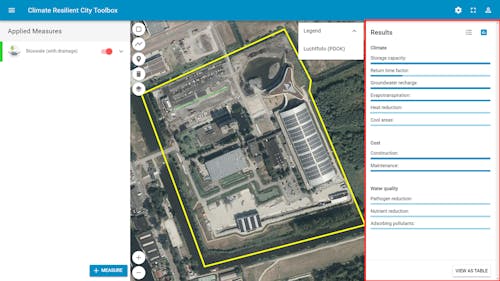
The results can be visualized both graphically as well as numerically.

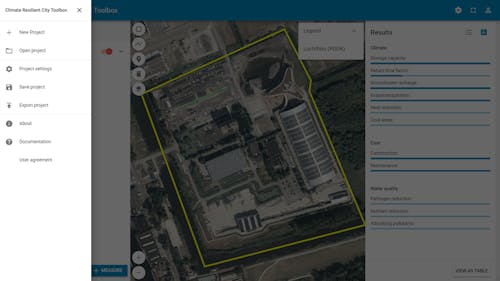
Saving and exporting results
Results can be saved through the menu button in the top left corner of the tool. To save the project select Save project and a file (.json) will be stored in the default download folder of your machine. This can be on the local machine or an attached network drive. In other words not in the cloud.
The project can be opened by selecting the Open project option in the same menu on the top left corner. Then select the .json file located on your local machine.
To export a project, select “Export project” in the menu. A project can be exported in CSV (Comma Separated Values file) which can be opened in a spreadsheet program and GEOJSON format that can be open in GIS software. Please note that exported data cannot be opened by the Climate Resilient City Tool.
Map Layers
Additional map layers to be shown, can be selected by pressing the layers button in the map window.
When this button is selected, several layers can be chosen to be shown in the map, similar to the layers provided below.
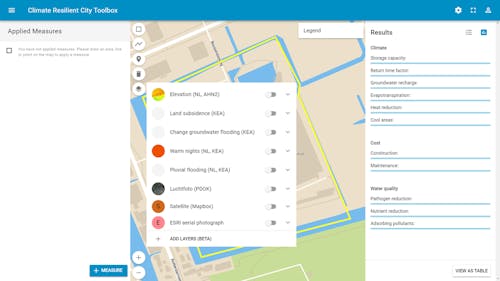
Additional map layers can be added by the user by pressing the Add layer button. These maplayers should located on a GIS-server and is accessible through either WMS, WMTS or arcrest. A more elaborate description can be found here.
When a legend is available at the GIS-server the legend of the active layers will be shown, in the top right corner of the map window
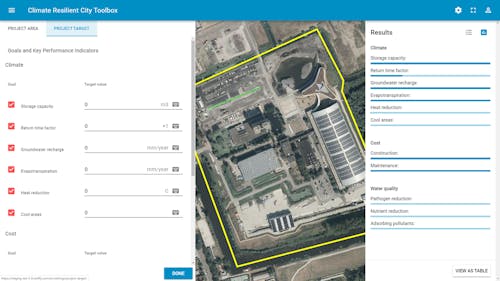
Project settings
Project settings can be accessed through the menu button in the op left corner or the quick access button in the upper right corner of the screen.
It is still possible to adjust the parameters or the shape of the project area in the settings menu.
Additionally, adaptation targets can be set in the PROJECT TARGET tab. Here desired adaptation targets (KPI's) for the project area can be set and the relevant (KPI's) to be shown in the Results tab (right of the map window) can be selected. The project targets are divided into the same indicators as in the results (climate, cost and water quality). A more elaborate description on setting adaptation targets can be found here.